Overview
CorneaMD is an integrated multi-omics database for corneal diseases, consolidating transcriptomic, single-cell, epigenomic, proteomic and metabolomic data to empower systematic investigations. Designed for intuitive exploration, we provide powerful search functionalities and analytical tools to investigate disease-gene relationships and multi-omics data for various corneal disorders. By bridging the gap between complex molecular data and clinical insights, this database serves as an indispensable resource for uncovering novel mechanisms, biomarkers, and therapeutic targets in corneal disease research.
1. Home Page
The homepage serves as the central gateway to all resources harbored in this database. This includes an overview of key functional modules, including Gene-Disease, Transcriptomics, Single-cell, Spatial-map, Epigenomics, Proteomics, Metabolomics— with direct access to their dedicated Portals. Additionally, the page features statistical summaries for various data categories, such as diseases, data types, and cell types, and more.

2. Gene-Disease Module
This module is designed for querying information related to corneal diseases and their associated genes. It is structured into two distinct search modes: a disease-centric search to identify causative genes, and a gene-centric search to explore linked diseases.
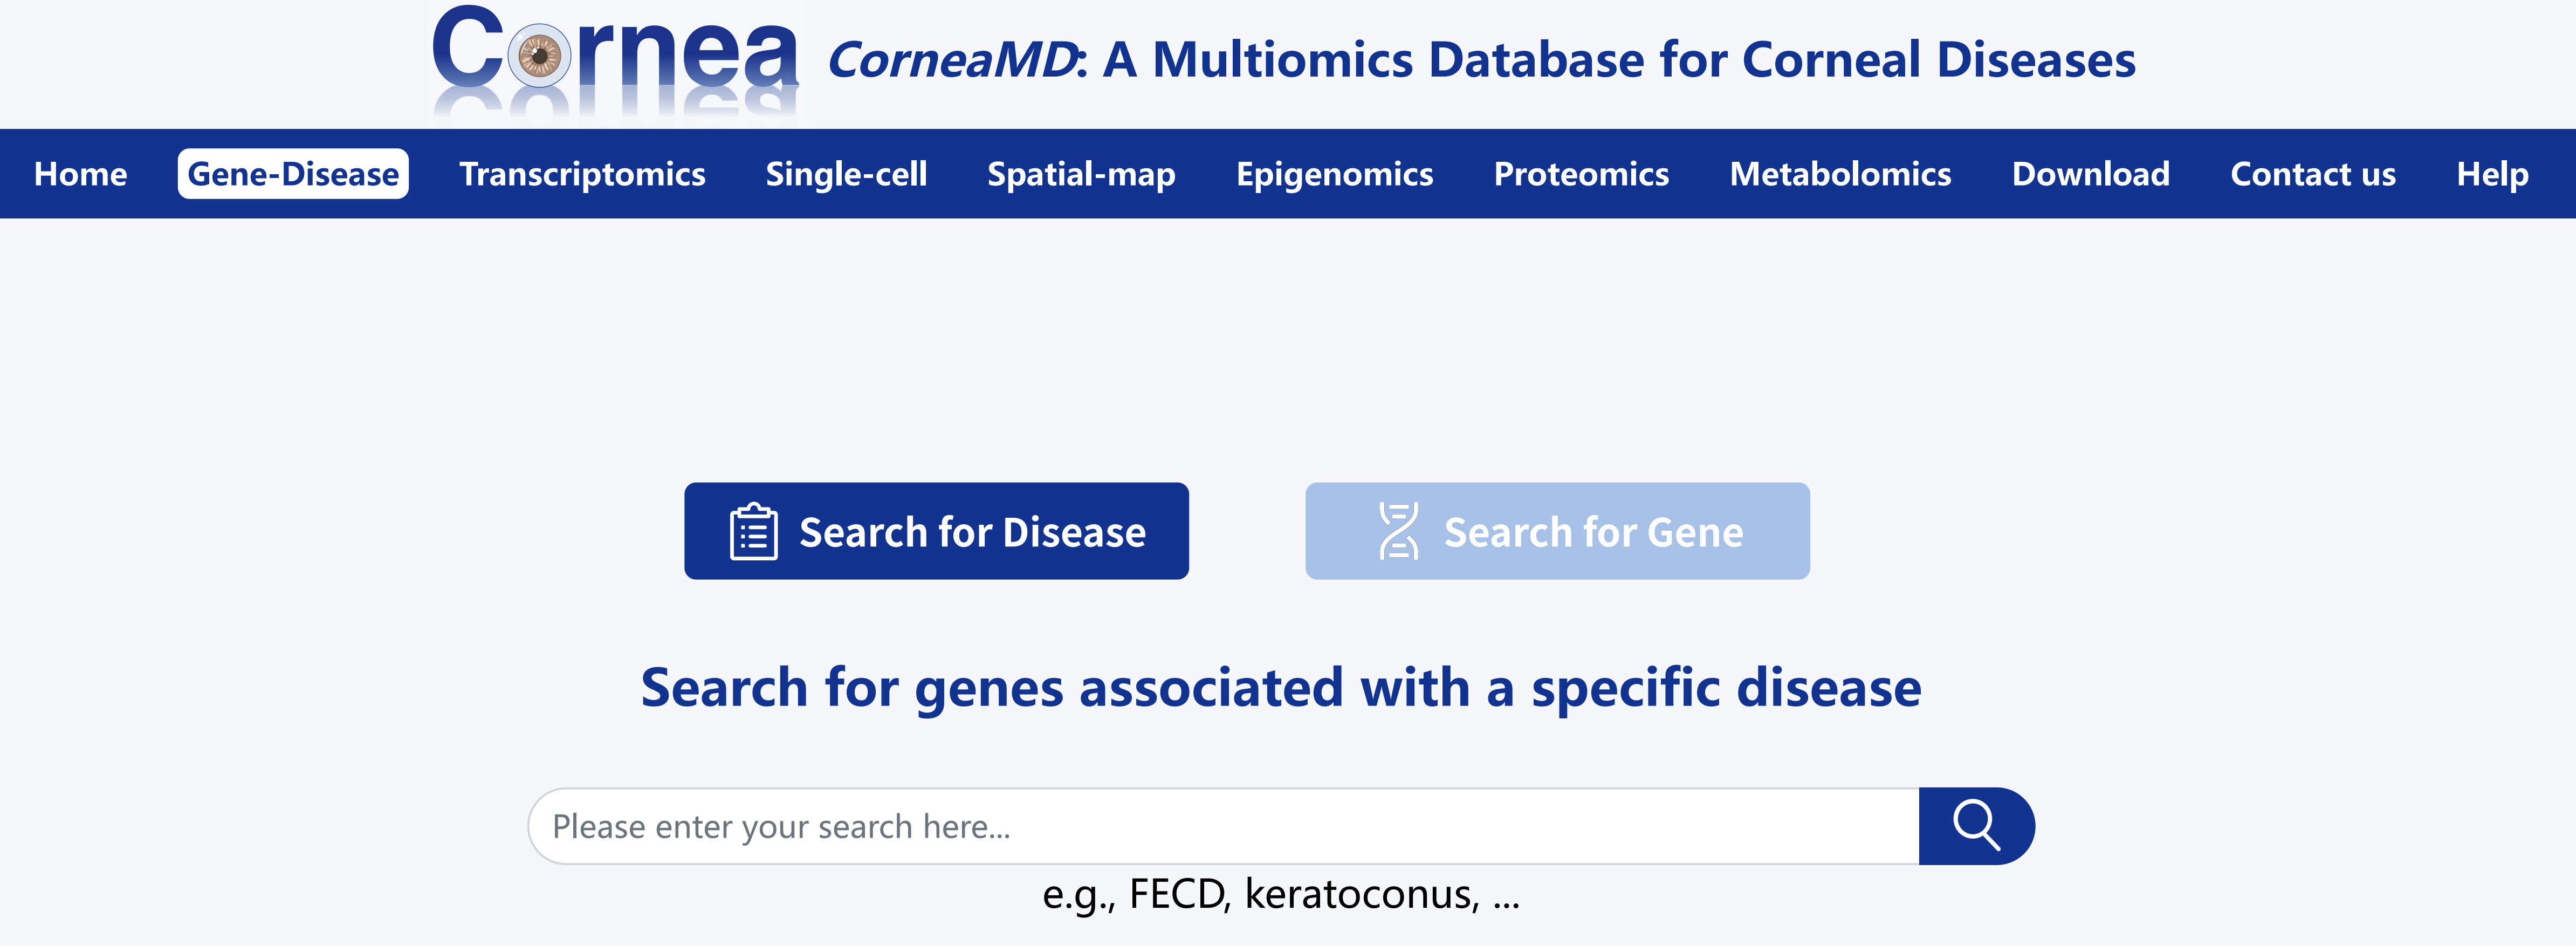
2.1 Search for Disease
Input the target disease name.
Browse the disease overview. Click the image on the right to view more disease-related pictures.
Review the list of associated genes and their known pathogenic variations.
Explore the multi-omics datasets relevant to this disease available in this database.
2.2 Search for Gene
Input the target gene name.
Browse the gene overview.
Review the list of associated diseases and their known pathogenic variations.
3. Transcriptomics Module
Filter available datasets by attributes such as Species, Sources, Conditions, and Technology. Alternatively, perform a direct search using a specific Dataset ID.
Review the general dataset information and navigate to the four main analysis modules: Differential Expression, Data Visualization, GO Enrichment, and KEGG Enrichment.
Within the Differential Expression module, enter your gene of interest and click "Draw boxplot" to generate a boxplot illustrating its expression across groups.
In the GO/KEGG Enrichment modules, select one or more terms of interest and click "Draw barplot"/"Draw dotplot" to visualize the selected terms with a bar chart or dot plot.
4. Single-cell Module
Select target datasets by applying filters such as Species, Sources, Conditions, and Technology. Alternatively, search directly by specific Dataset ID.
Examine the gene set information and access the analytical modules. The interface dynamically displays either:
- Five sections (with group comparison): Data Visualization, Cell Type Statistics, Differential Expression, Functional Enrichment, and Signature Score.
- Four sections (without group comparison): Data Visualization, Cell Type Statistics, Cell Type Signature, and Signature Score.
4.1 Data Visualization
This section enables comprehensive visualization of single-cell data through dimensionality reduction plots. Users can first select a reduction method (UMAP or t-SNE) and a coloring scheme (Sample or Group) to observe the fundamental cell distribution. To investigate specific gene expression patterns, simply enter a target gene name in the input box. Clicking "Feature Plot" will project the gene's expression levels onto the current dimensionality reduction layout, while clicking "Violin Plot" will generate a detailed visualization of the gene's expression distribution across different cell types or experimental groups - the grouping logic automatically aligns with the selected "Colored by" scheme.
4.2 Cell Type Statistics
This section displays the quantity and proportion of each cell type in the form of Bar Charts and Pie Charts.
4.3 Differential Expression
This section displays marker genes for specific cell types or differentially expressed genes (DEGs) between comparison groups.
4.4 Functional Enrichment/Cell Type Signature
In this section, users can select the cell type, group, regulation, and enrichment method (GO/KEGG) of interest to view functional enrichment results. Click "Draw Barplot" or "Draw Dotplot" to visualize selected terms from the tables.
4.5 Signature Score
This section enables functional gene set scoring analysis on the data. Users can: define a target gene set by selecting a source database (GO or KEGG) and a specific term. Choose the comparison scope in the "Group by" field and click the "Draw Graph" button to compute and visualize the scores across cell types or groups.
5. Spatial-map Module
This module includes six sections: Chip Visualization, Data Visualization, Cell Type Statistics, Differential Expression, Functional Enrichment, and Signature Score.
In Chip Visualization, users can select a sample to view cell distribution on the chip or choose a gene of interest to map its expression directly. The other sections are similar to those in the single-cell module; please refer to the single-cell tutorial for guidance.
6. Epigenomics Module
Select target datasets by applying filters such as Species, Sources, Conditions, and Technology. Alternatively, search directly by Dataset ID.
This module supports both single-cell (scATAC-seq) and bulk (ChIP-seq, ATAC-seq) data types:
- Five sections of scATAC-seq: Data Visualization, Cell type statistics, Cell type signature, Functional enrichment, and Genome browser.
- Four sections of ChIP-seq and ATAC-seq: Differential peaks, GO enrichment, KEGG enrichment, and Genome browser.
6.1 Differential Peaks
This section displays differentially accessible regions. Users can click "Genomic Annotation Distribution" to view the annotation results corresponding to these regions.
6.2 Genome Browser
In this section, users can select target cell types or group data to load into IGV, choose gene regions of interest in the "Search Gene" box, and visualize peak profiles directly in IGV.
7. Proteomics Module
Select target datasets by applying filters such as Species, Sources, Conditions, and Technology. Alternatively, search directly by Dataset ID.
Examine the general dataset information and explore the four main analysis modules: Differential Expression, Data Visualization, GO Enrichment, and KEGG Enrichment.
8. Metabolomics Module
Select target datasets by applying filters such as Species, Sources, Conditions, and Technology. Alternatively, search directly by Dataset ID.
Examine the general dataset information and explore the three main analysis modules: Differential Expression, Data Visualization, and KEGG Enrichment.